Southern California Temperature Index
The Southern California Temperature Index (SCTI) represents the ocean water temperature anomaly near the coast of California. It is based on temperature records from the California Underwater Glider Network (CUGN), a collection of over 16-years of Spray underwater glider measurements.
The SCTI is the interannual temperature anomaly at 50m depth along the coastal section of Line 90 (coast to 200-km offshore) with a 3-month running mean applied. It is provided with the same temporal averaging as the Oceanic Niño Index.
Data Access
Data are available in many formats including CSV or NetCDF files. Use our ERDDAP server for additional file types, data subsetting, visualization options and more.
This dataset is updated monthly and was last updated . The most recent data available are from which represents the midpoint of the latest 3-month average.
Data Usage and How to Cite
You are welcome to download and use these figures and the associated data. If you use the data in a publication please include the following references in your bibliography.
- Rudnick, D. L., K. D. Zaba, R. E. Todd, and R. E. Davis, 2017: A climatology of the California Current System from a network of underwater gliders. Progress in Oceanography, 154, 64-106; doi: 10.1016/j.pocean.2017.03.002
- Rudnick, D. L., K. D. Zaba, R. E. Todd, and R. E. Davis, 2017: A climatology using data from the California Underwater Glider Network - Dataset [Downloaded at XXXX]. Scripps Institution of Oceanography, Instrument Development Group. doi: 10.21238/S8SPRAY7292
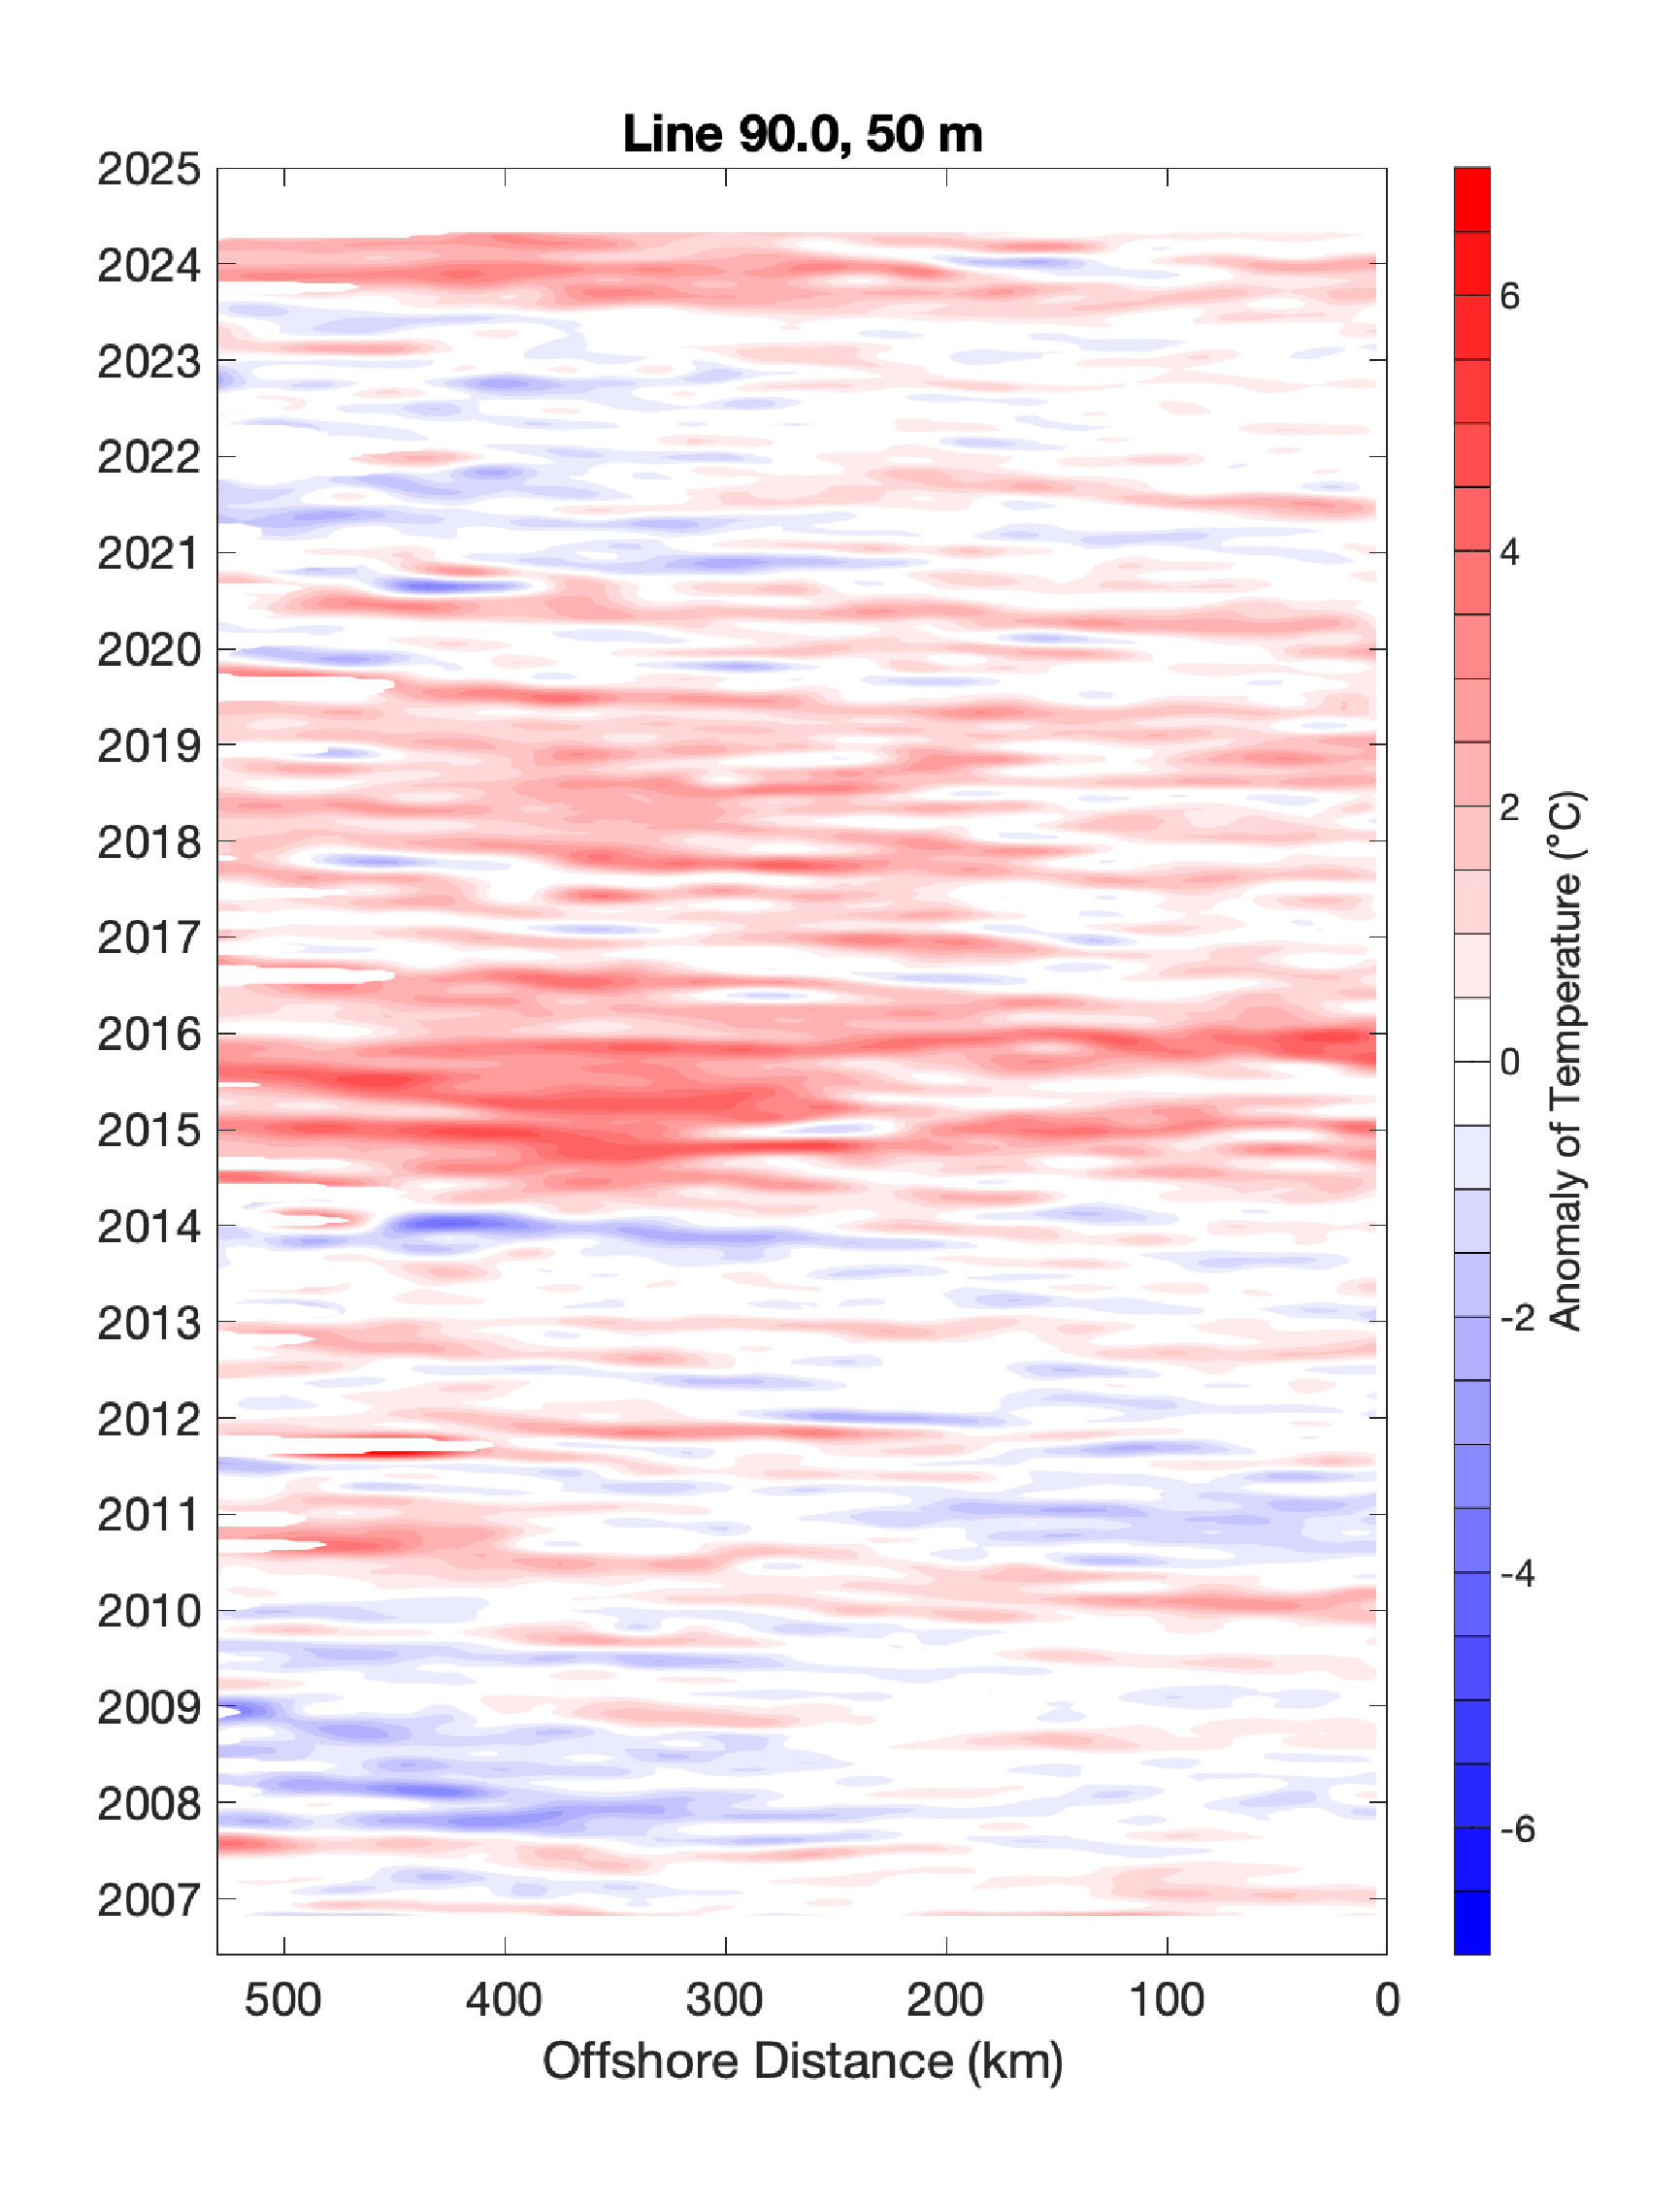
The Southern California Temperature Index is calculated using 16-years of water temperature records from the nearshore 200-km of CUGN Line 90 at a depth of 50-meters. The map shows the section of Line 90 that is used for the SoCal Index. The following Hovmoller diagram shows the past 16 years of glider data along the Line 90 transect at 50 meters depth. The first 200-km on the right side of the plot are used for the SoCal Index.