Solomon Sea Transport and Climatologies
The Solomon Sea transport time series is derived from more than a decade of Spray glider missions in the Solomon Sea providing measurements of temperature, salinity and depth averaged velocity.
Data Access
Transport Time-Series
Last updated May 2020
Solomon Sea transport data. Both section-mean and low-pass monthly time-series in a NetCDF file.
SolomonSea_Transport.nc (29 KB)Included variables are: Cross-Sea integrated total and geostrophic transport (Sv) for all available coast-to-coast sections, in individual section-mean and interpolated monthly values, low-pass filtered (5-month triangle) and used to define interannual anomalies. See more details in the PMEL Solomon Sea Transport page methodology section.
For more information: PMEL Transport webpage
Climatology of currents, temperature and salinity
Last updated May 2020
Four zipped NetCDF files include all the climatology data from both the northern track and southern track.
SolomonSea_Climatology.zip (2.3 MB)Included variables
- in-situ temperature
- practical salinity
- potential temperature
- potential density
- binned transport (as function of depth and cross-basin distance)
- vertically-averaged velocity (directly measured)
- pseudo-velocity (an estimate of the magnitude of equatorward flow derived from the cross-track absolute geostrophic velocity)
For more information: PMEL climatology webpage
How to Cite
Cite the full data set of glider measurements including temperature and salinity profiles, and vertically-averaged absolute velocity:
- Davis, R. (2016). Solomon Sea Ocean Transport from Gliders [Data set]. Scripps Institution of Oceanography, Instrument Development Group. doi: 10.21238/S8SPRAY2718
Cite the Transport time-series
- Kessler, W.S. and H.G. Hristova (2019). Solomon Sea volume transport time- series measured by glider [Data set]. Scripps Institution of Oceanography, Instrument Development Group. doi: 10.21238/S8SPRAY2718A
Cite the Climatology of currents, temperature and salinity
- Kessler, W.S. and H.G. Hristova (2021). Climatology of Solomon Sea currents, temperature and salinity measured by glider [Data set]. Scripps Institution of Oceanography, Instrument Development Group. doi: 10.21238/S8SPRAY2718B
Reference
Kessler, W.S., H.G. Hristova and R.E. Davis (2019). Equatorward western boundary transport from the South Pacific: Glider observations, dynamics and consequences. Progress in Oceanography, 175, 208-225. doi: 10.1016/j.pocean.2019.04.005
Corresponding author's email (ask for copy of paper): william.s.kessler@noaa.gov
Selected Figures from the PMEL Web Site
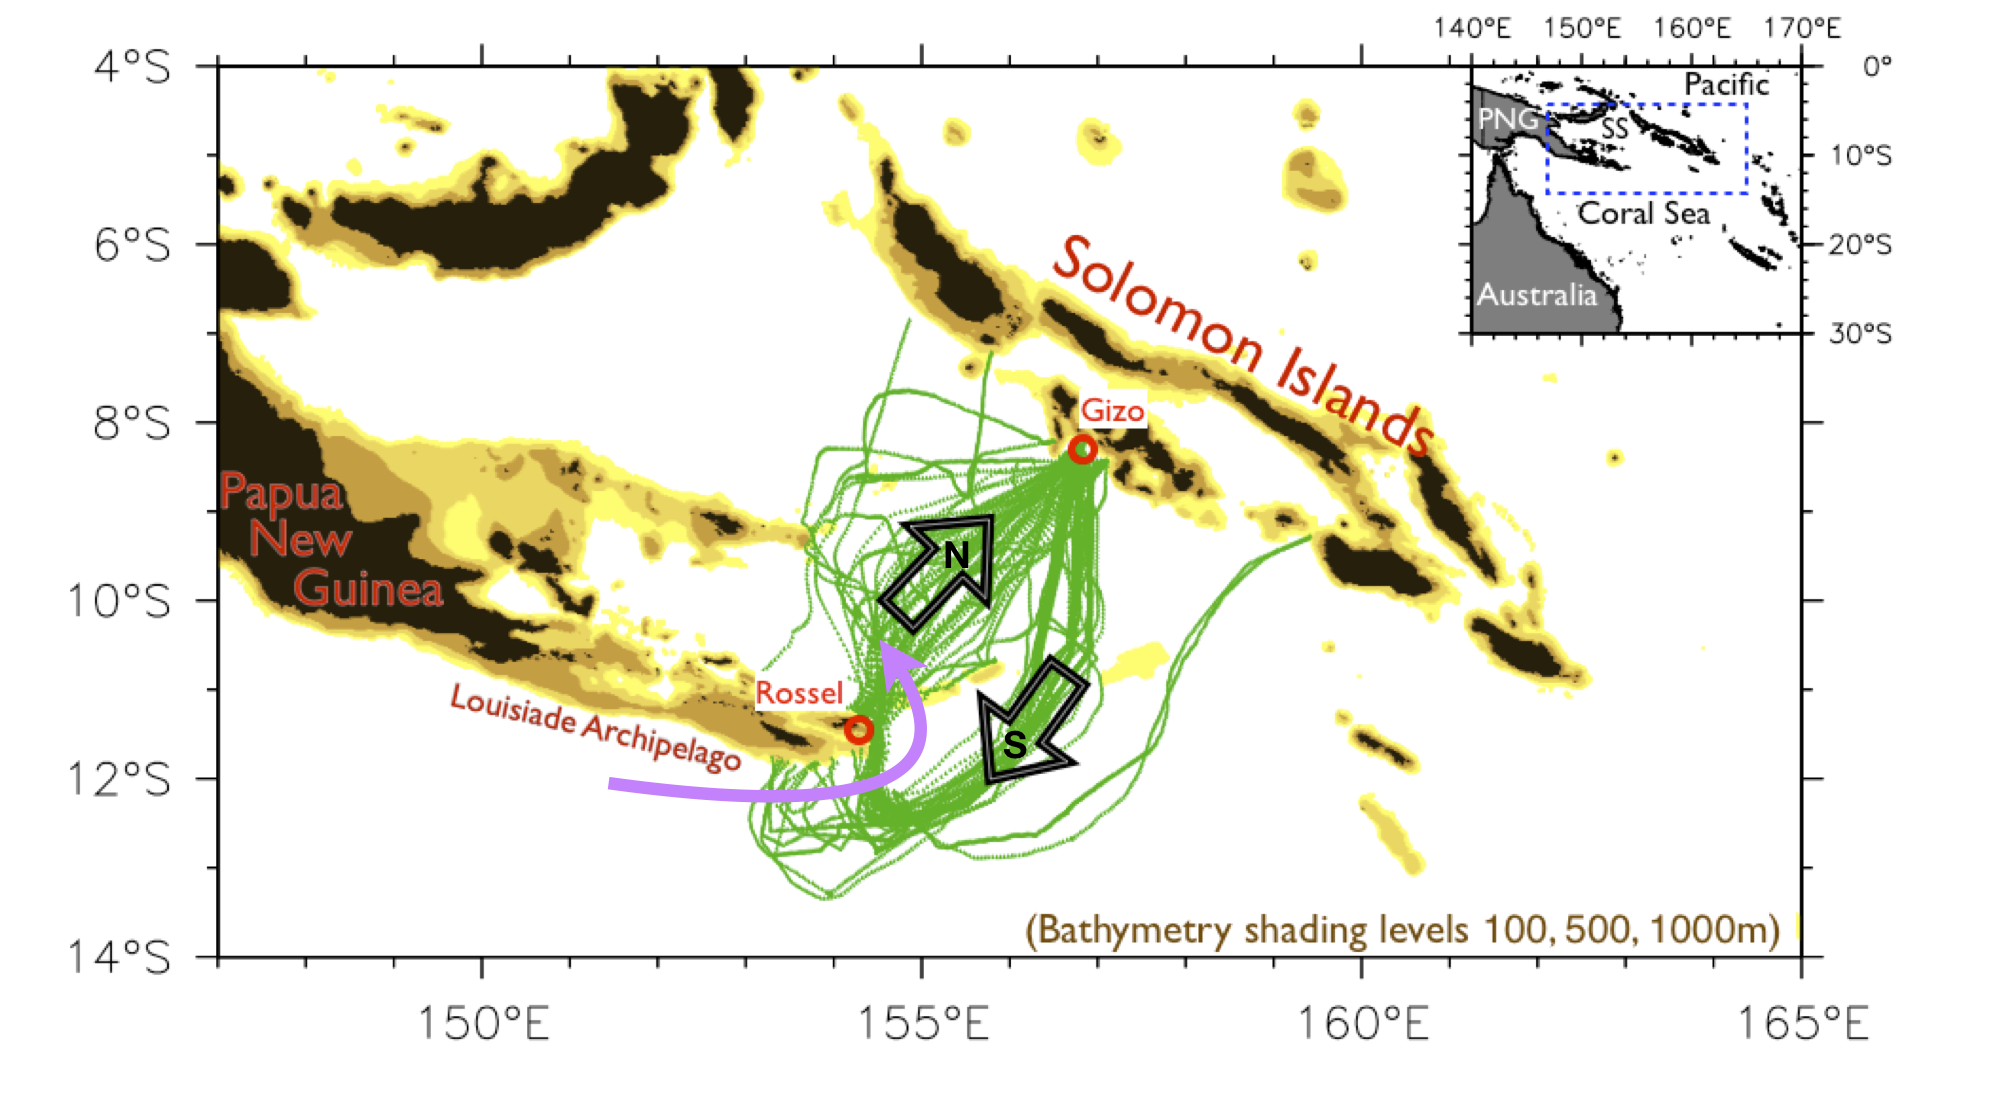
Figure 1: Bathymetric map of the Solomon Sea (shading levels at lower right) showing the near-continuous shallow reefs from 5°S to 10°S on the Solomon Island side, and extending to Rossel Island on the Papua New Guinea side. These archipelagos are effective barriers to ocean circulation, so the glider Gizo-Rossel transects sample the whole transport. Red circles marked “Gizo” and “Rossel” show the section endpoints. Green dots show individual glider dives and the separated southern (westbound) and northern (eastbound) tracks, where the overlaid black arrows show the track direction. This track separation is required because the western boundary current entering the Solomon Sea from the southwest (pink arrow) is very strong. The westbound glider route stays offshore so the glider enters this current sufficiently upstream to reach Rossel. The small inset map shows the location of the Solomon Sea (“SS”) in the southwest Pacific.
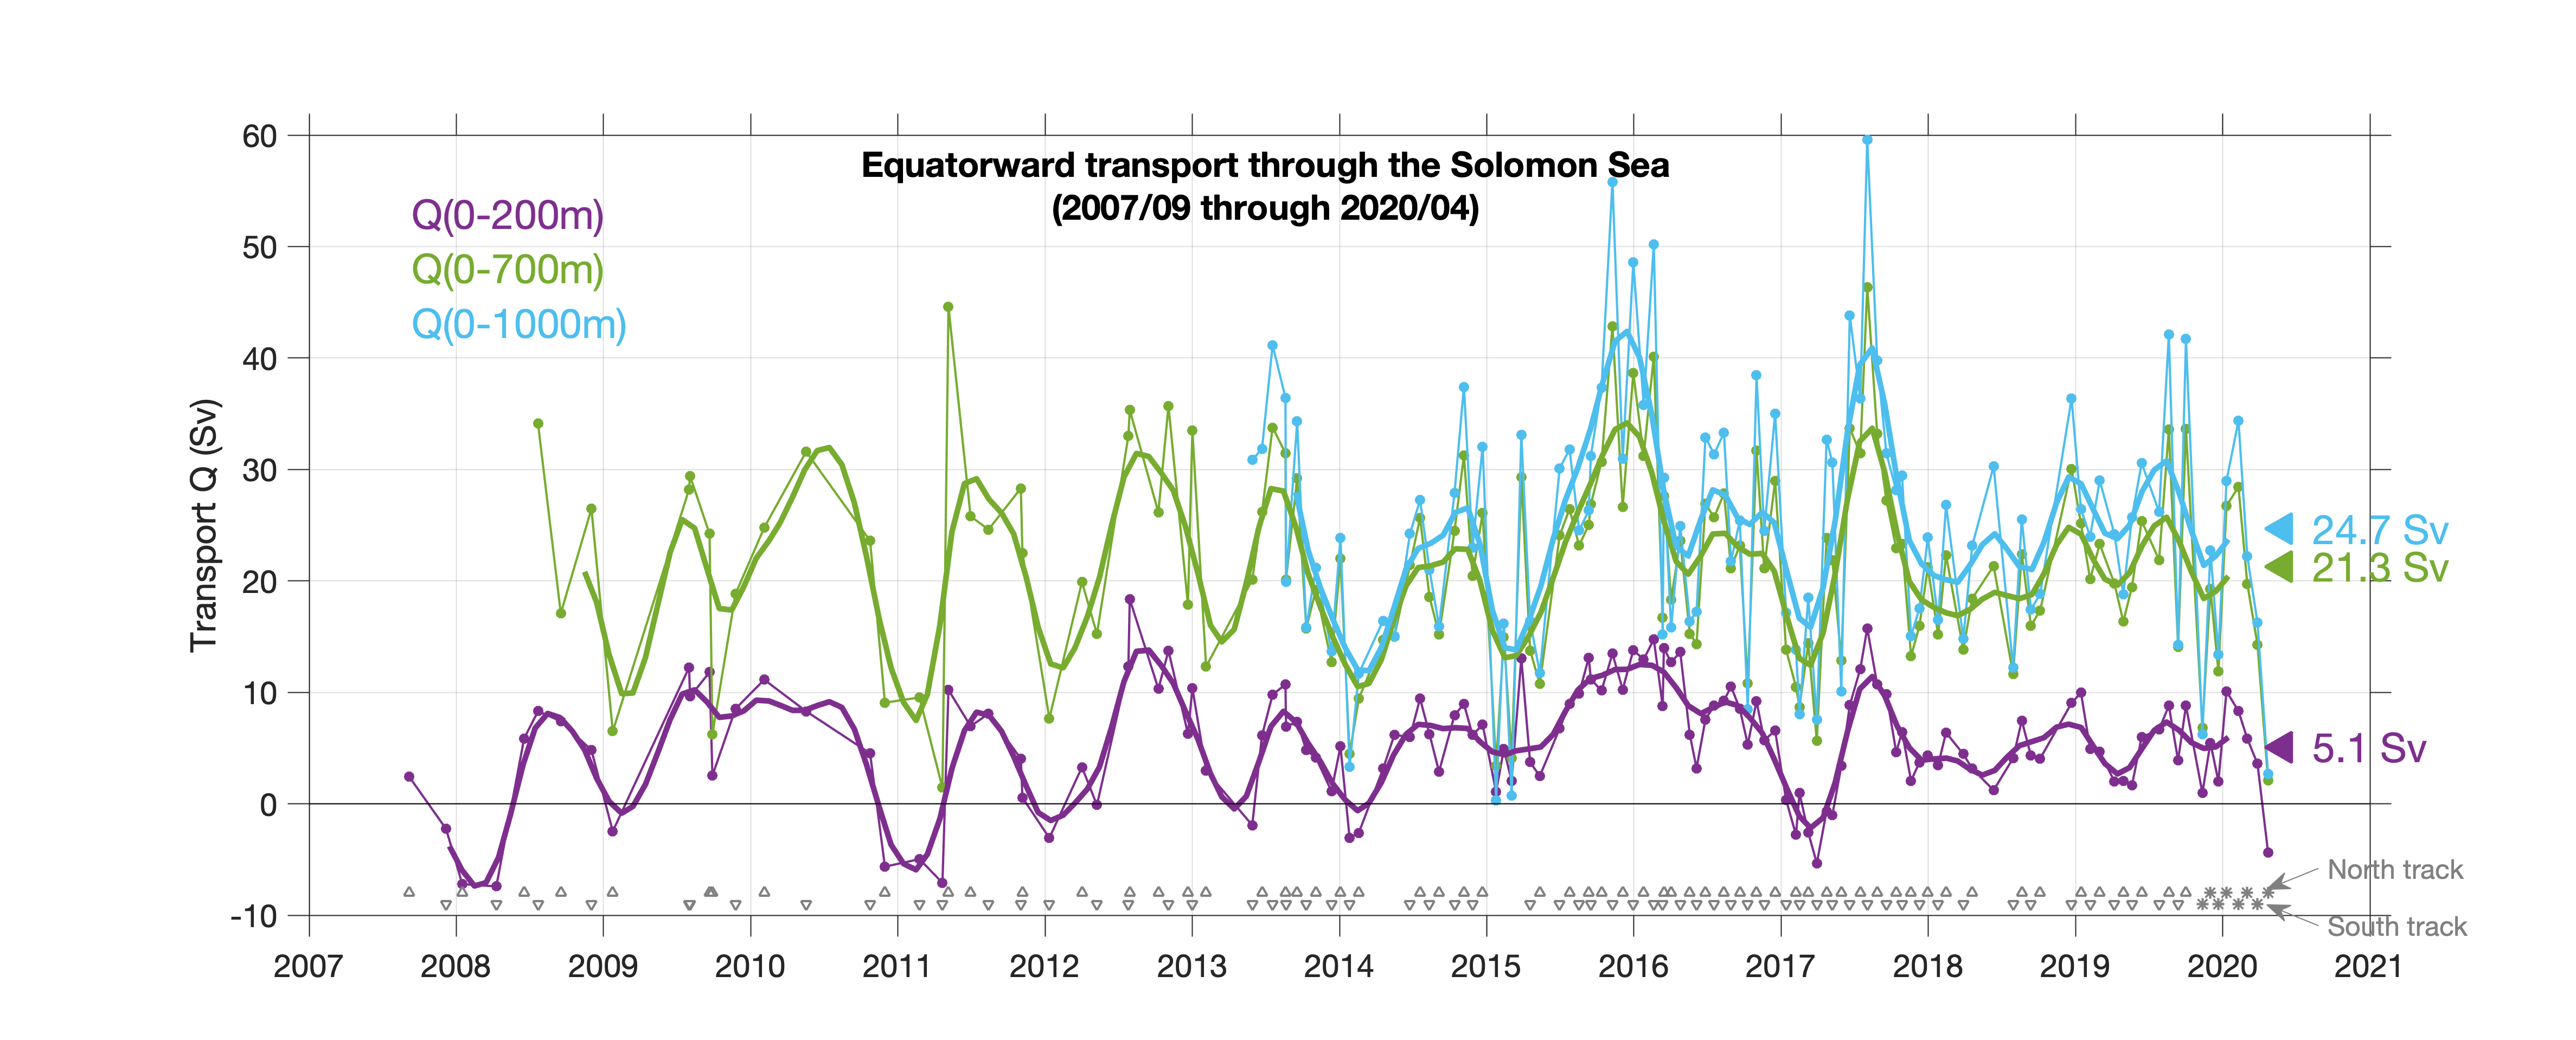
Figure 2: Time series of coast-to-coast volume transport Q (Sv) through the Solomon Sea. Three depth ranges are shown 0-200m (purple), 0-700m (green), and 0-1000m (blue). Sampling to 700m began in 2008, to 1000m in 2013. Values at right give the mean transport for each case. Dots show individual section values and are noisy. Smooth curves show “low-frequency variability”, defined as the sum of the average annual cycle plus the anomalies from this smoothed by a 5-month triangle filter. Gray symbols along the time axis show the date and track (northern or southern) for each section, with stars indicating real time data that has not yet been quality-controlled.
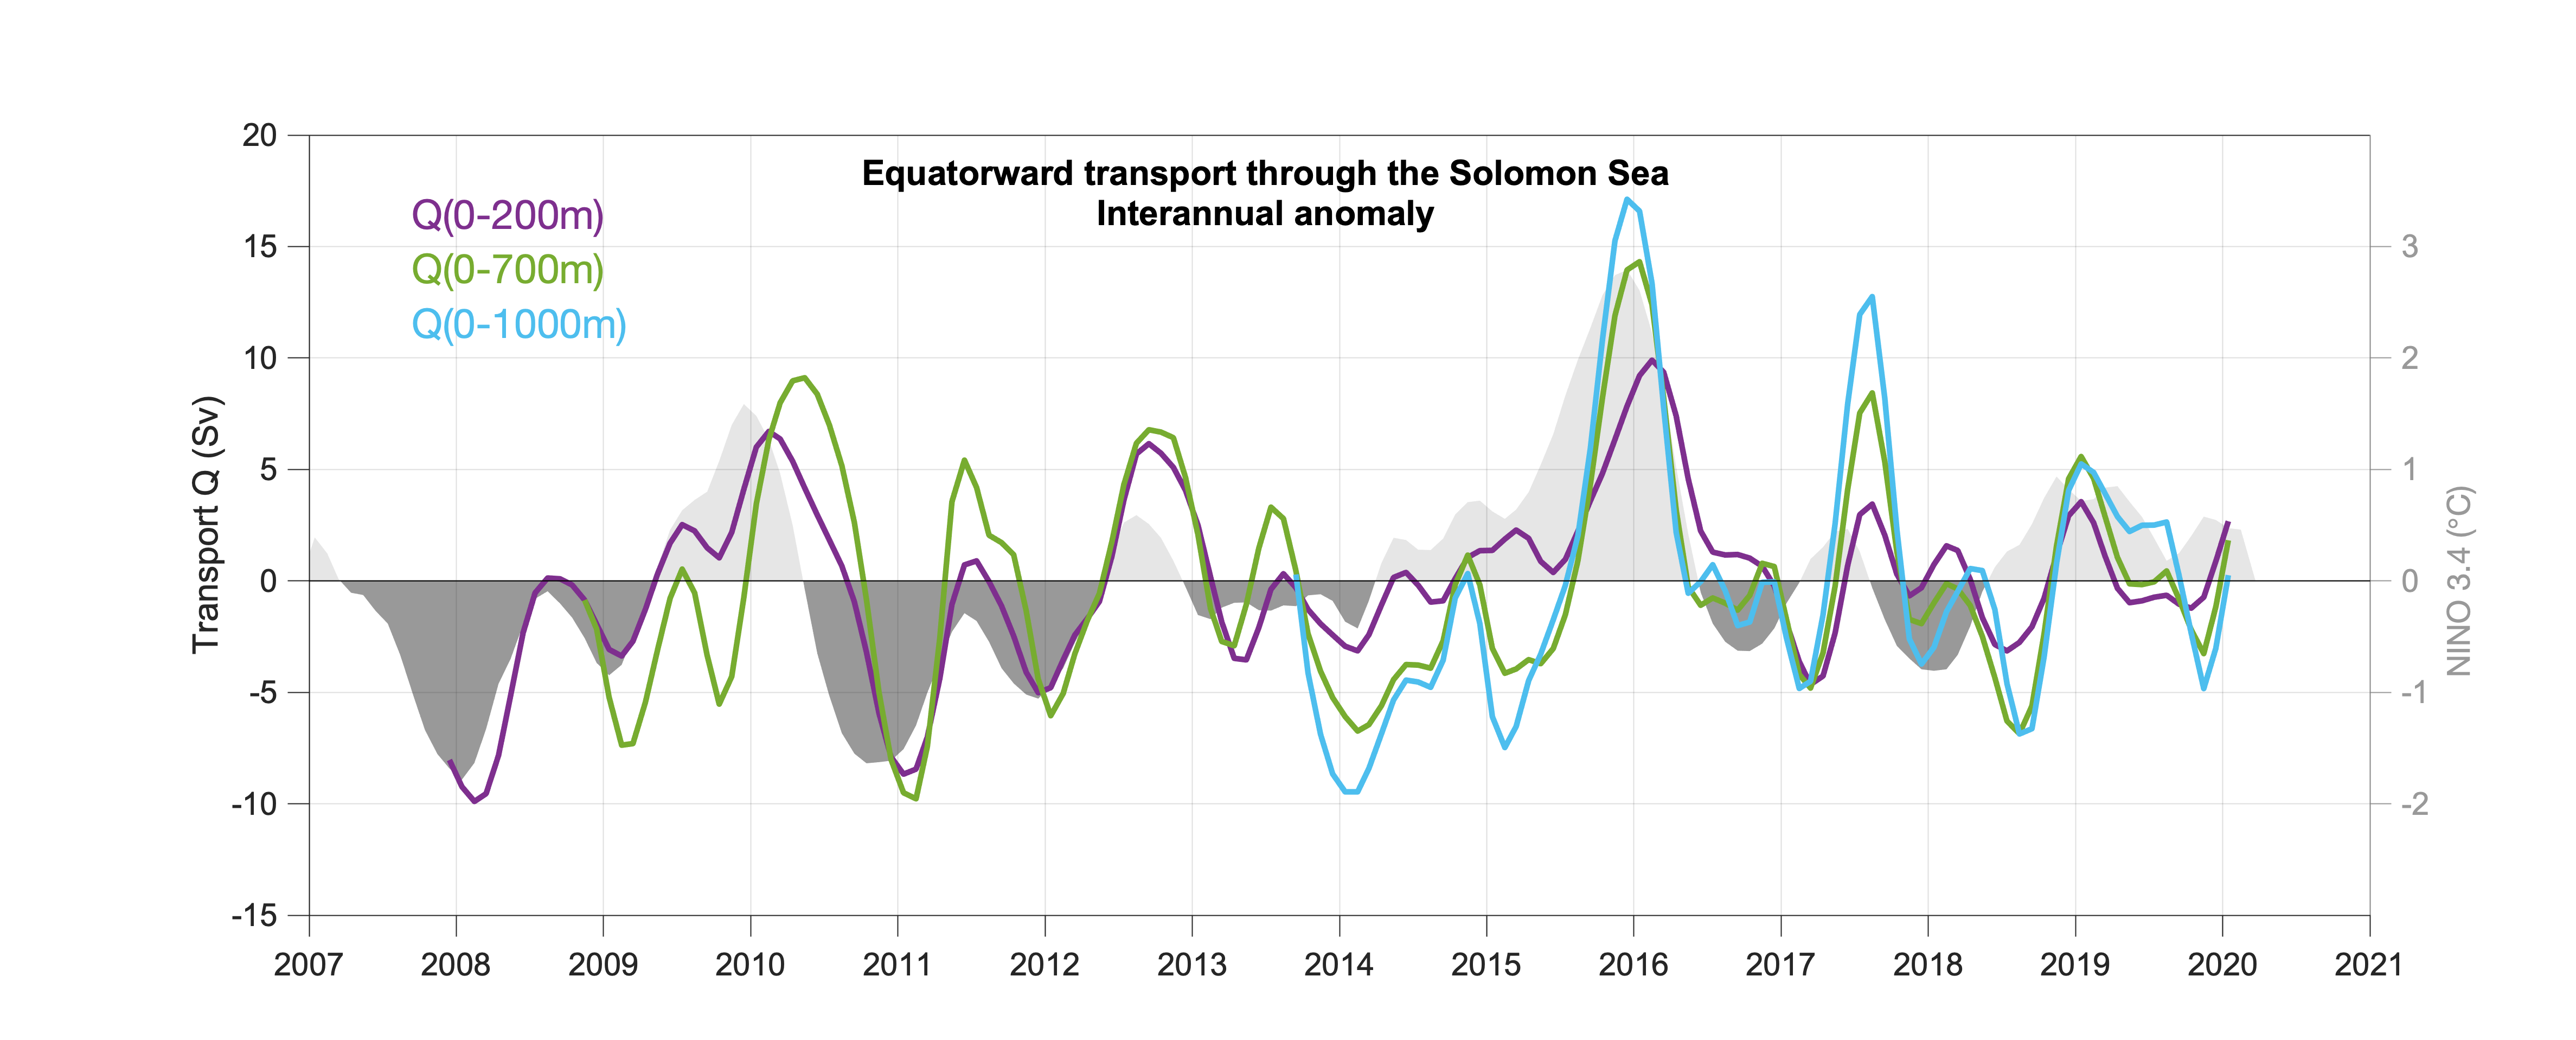
Figure 3: Interannual anomalies of coast-to-coast volume transport Q (Sv) through the Solomon Sea. Three depth ranges are shown: 0-200m (purple), 0-700m (green), and 0-1000m (blue). Sampling to 700m began in 2008, to 1000m in 2013. Interannual anomalies are defined as the time series minus its average annual cycle, smoothed with a 5-month triangle filter. Gray shading shows the Niño3.4 index (https://www.weather.gov/fwd/indices) representing the El Niño/La Niña conditions along the equator in the central Pacific. This index is similarly smoothed.
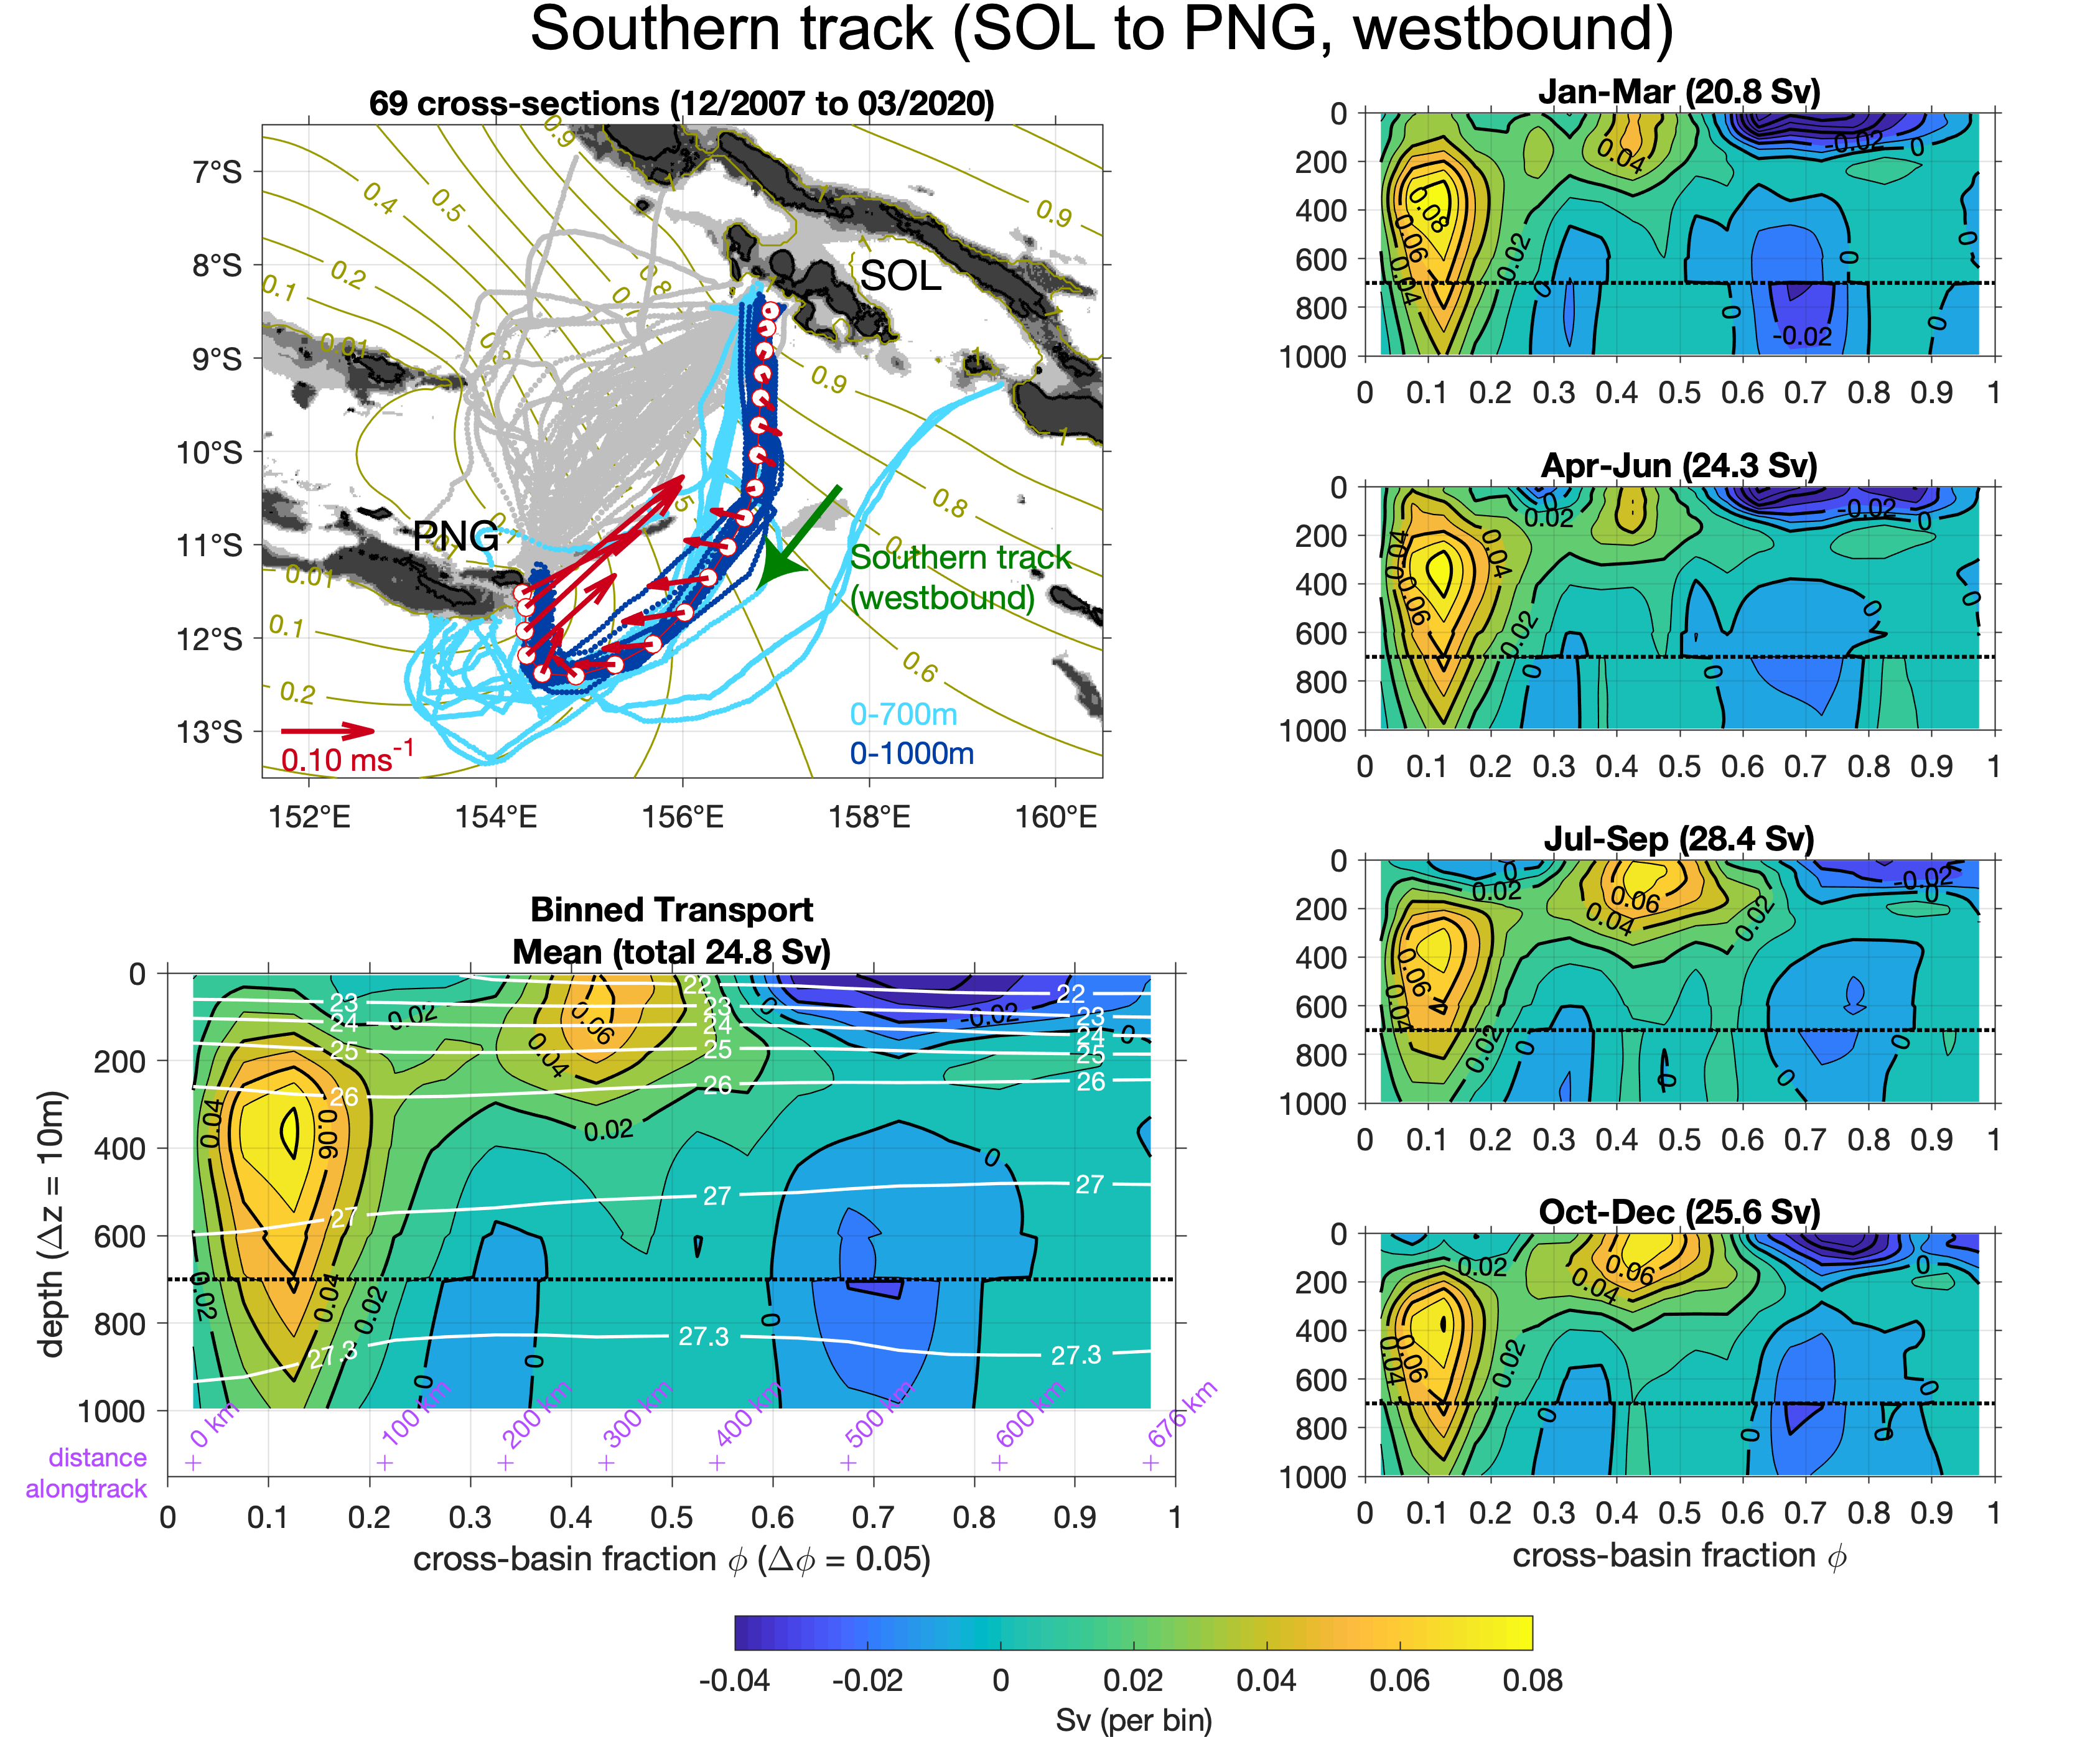
Figure 4: Annual-mean and seasonal averages of the binned (in depth and cross-basin fraction) transport on the southern tracks (sampled westbound, SOL to PNG). On the southern track, the velocity structure shows two distinct cores: shallow mid-basin inflow, and a much thicker western boundary current, the New Guinea Coastal Undercurrent (NGCU), that extends with great magnitude to and below the sampling depths of 700m and 1000m. Positive values indicate equatorward transport. Transport is maximum in Jul-Sep, and weakest in Jan-Mar, varying by ±3 Sv from its mean of 25 Sv. The annual cycle of transport is largely controlled by the variations of the mid-basin inflow strength.
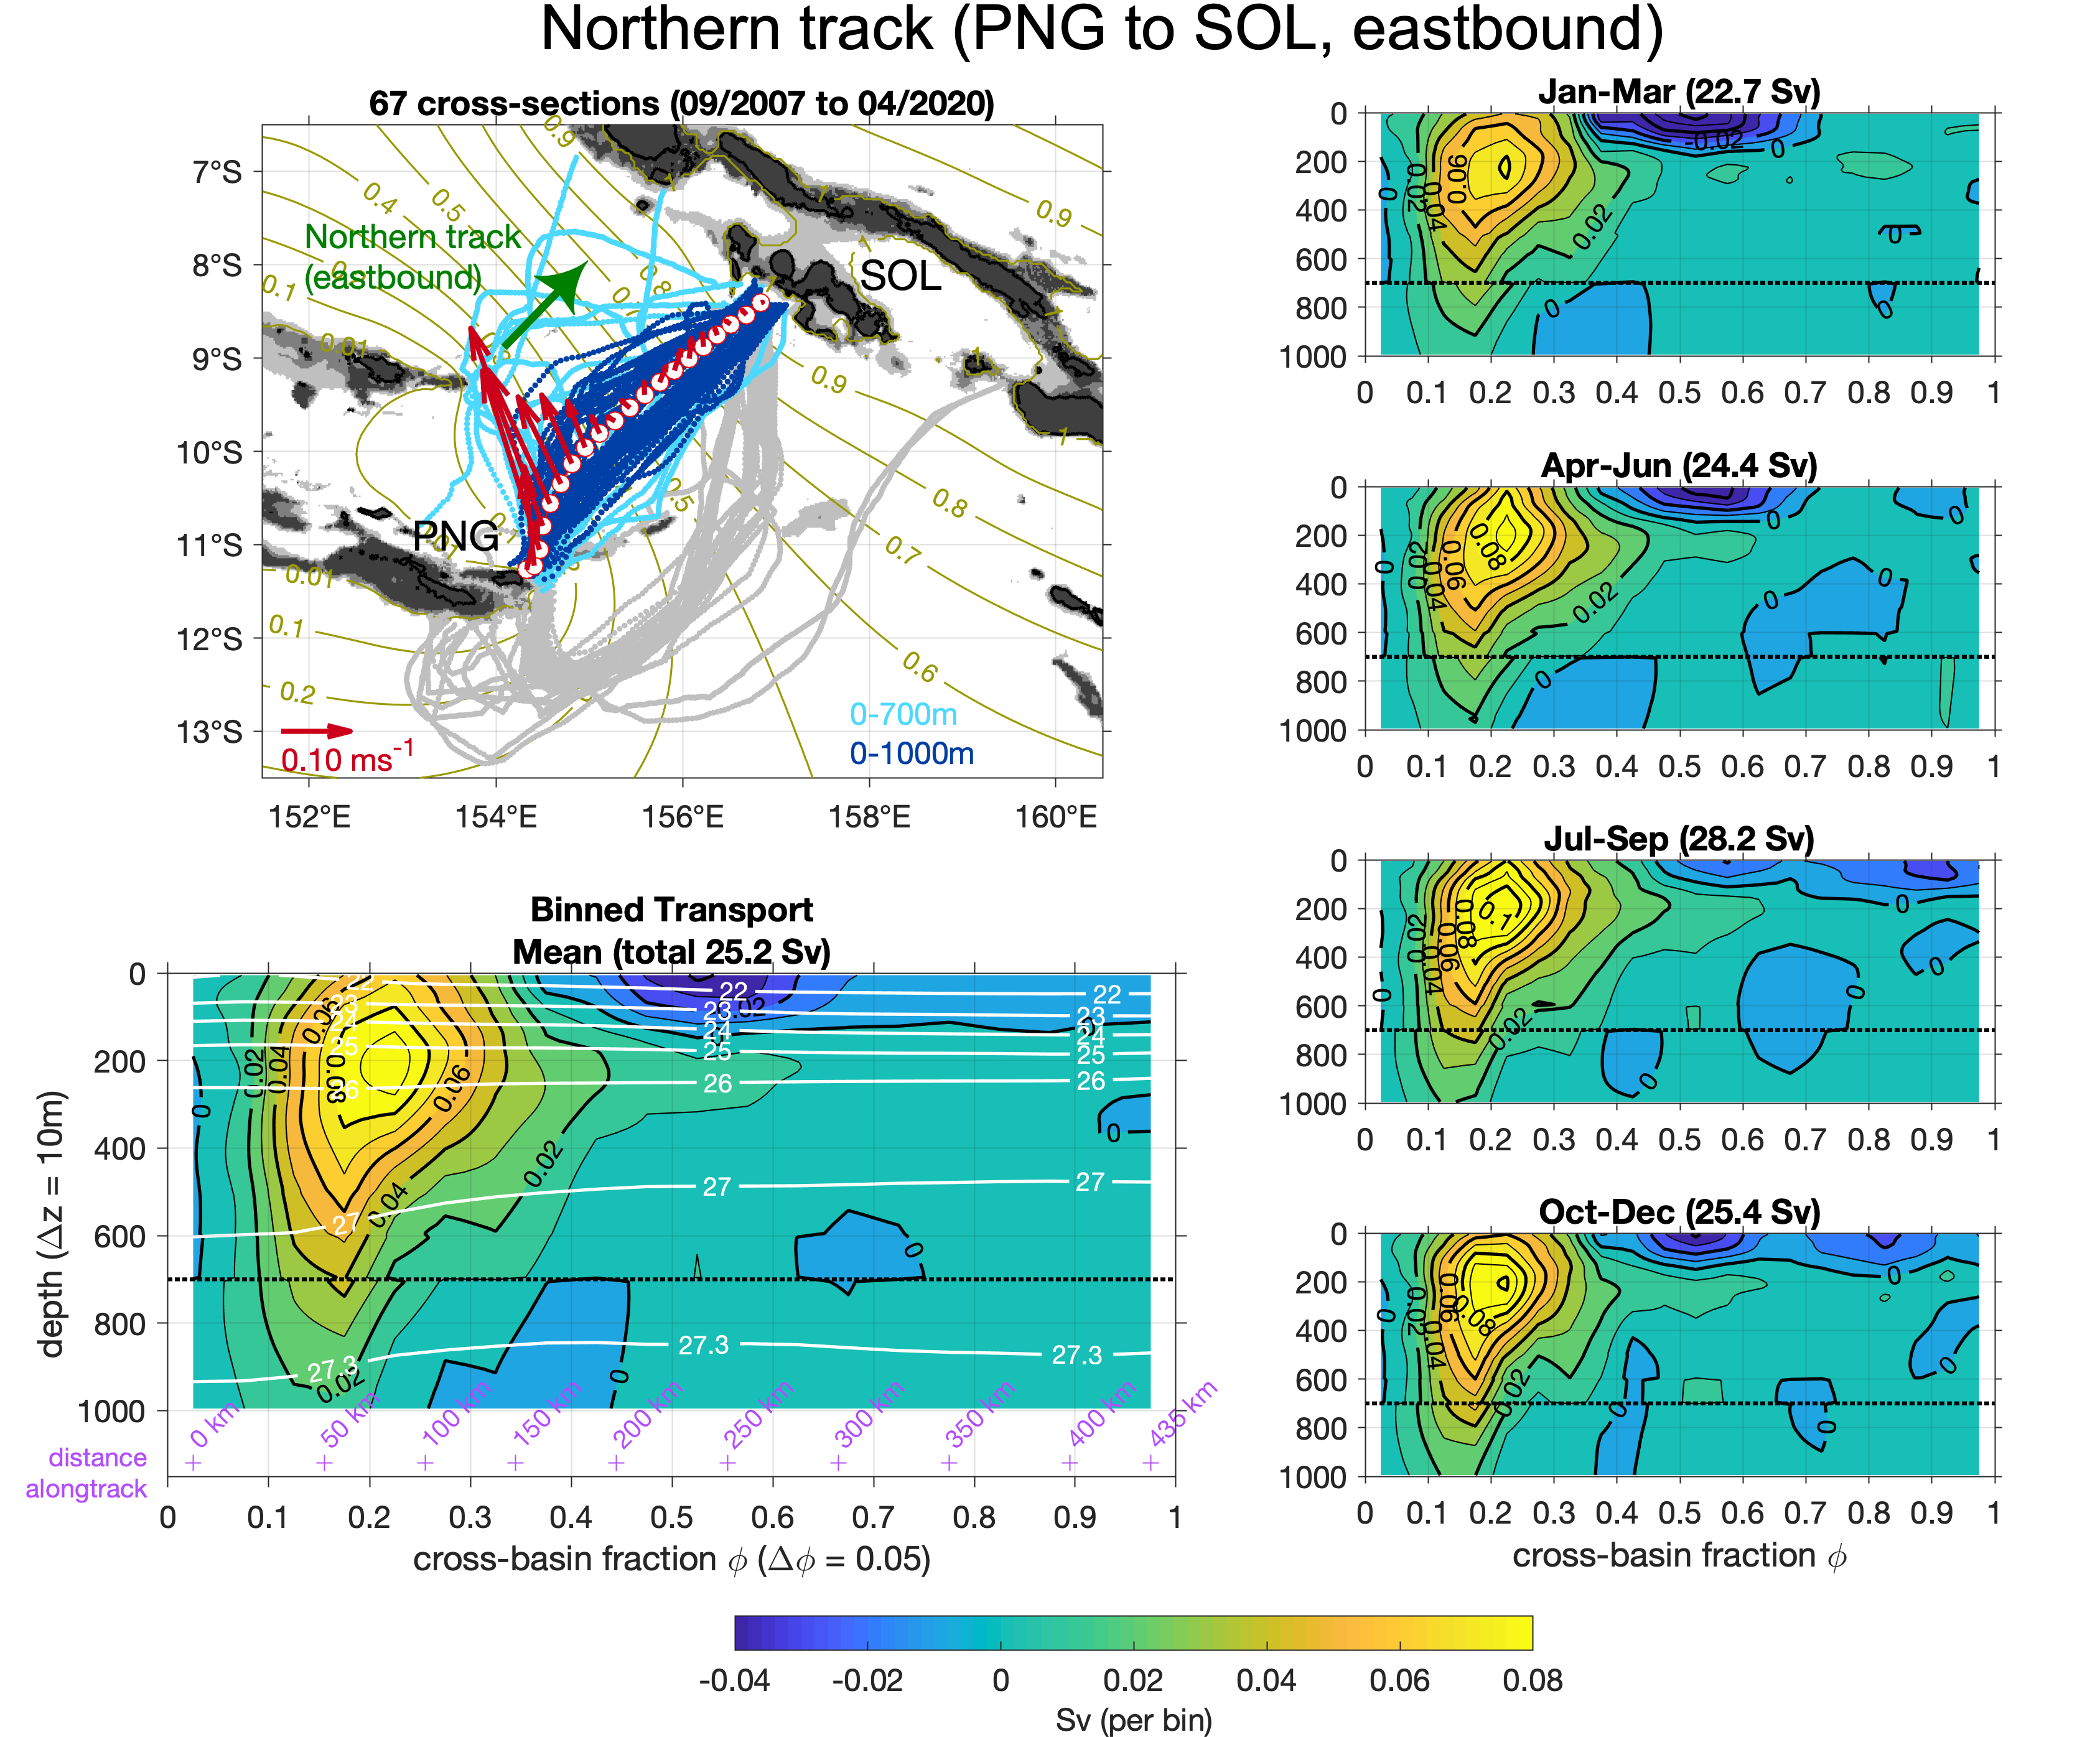
Figure 5: Annual-mean and seasonal averages of the binned (in depth and cross-basin fraction) transport on the northern tracks (sampled eastbound, PNG to SOL). On the northern track, the velocity structure shows a single, broader maximum in the west where the NGCU and the mid-basin inflow have apparently merged into a single current on the PNG side. Positive values indicate equatorward transport. Transport is maximum in Jul-Sep, and weakest in Jan-Mar, varying by ±3 Sv from its mean of 25 Sv.