Observing El Niño with Gliders
Glider measurements offer unique insight into El Niño and its impacts to California's coastal waters
What is El Niño?
An El Niño occurs when the trade winds over the Pacific Ocean weaken or even reverse causing the eastern equatorial Pacific to warm. El Niño is felt across the entire Pacific Ocean, including in California waters, with effects generally peaking near the end of the calendar year.
The term El Nino was coined centuries ago by South American fishermen who observed alarming effects of warm ocean water on their fish catch and sea birds. They named the phenomenon El Niño because of the timing near Christmas. El Niño impacted their food supply and livelyhoods and even today we are similarly impacted by El Niño events in the 21st century.
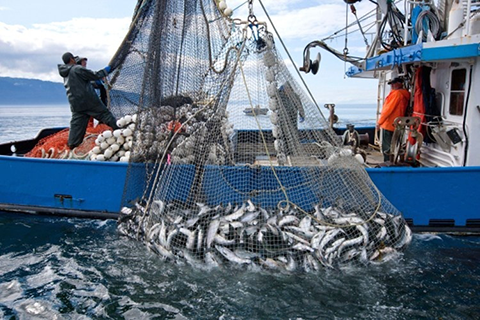
In normal conditions along the west coast of the Americas, there is strong upwelling that brings cool nutrient-rich water to the surface. This supply of nutrients feeds some of the most productive fisheries in the world. One of the effects of a strong El Niño is to shut down this upwelling with harmful effects on the ecosystems and fisheries.

Josh Edelson, AFP/Getty Images
NOAA Fisheries

NOAA
Monitoring the Effects of El Niño with Gliders
We developed the California Underwater Glider Network (CUGN) in 2005 to monitor the effects of El Niño in the California Current System (CCS).
Long-term observations like these allow us to see how events like El Niño compare to baseline conditions.
The California Underwater Glider Network uses Spray underwater gliders making repeated dives from the surface to 500 m deep and back, to provide a 3 dimensional view of how the ocean is changing over time. A glider repeats this cycle every 3 hours, and travels 2 miles during that time.
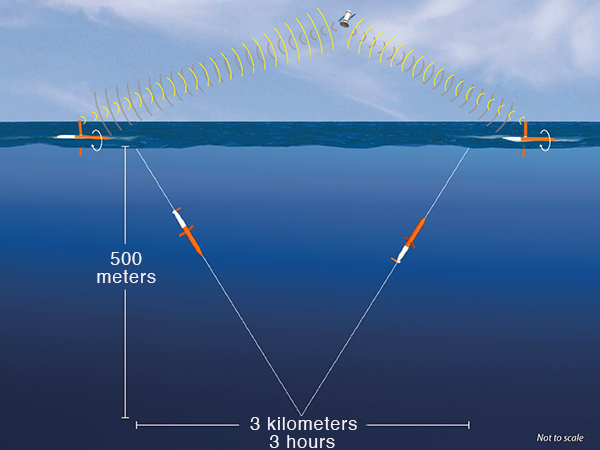
Image credit: Jack Cook (WHOI)
The CUGN includes gliders on three of the traditional cross-shore CalCOFI lines: line 66.7 off Monterey Bay, line 80 off Point Conception, and line 90 off Dana Point.
Two new lines were added in 2019 at line 56.7 north of Bodega Bay, and alongshore at the shelf break between lines 80 and 90.
El Niño in Southern California
(versus at the Equator)
We noticed strong coupling between ocean temperature at the equator and our glider measurements of the California Current System, so we created the Southern California Temperature Index (SCTI) as a way to easily track the two.
The Oceanic Niño Index (ONI) is a measure of sea surface temperature at the equator that NOAA uses to determine El Niño conditions. Our SCTI is a similar measure of ocean temperature in the Southern California Bight. These indices tell the deviation of ocean temperature from normal for that time of year.
Learn more about the SCTI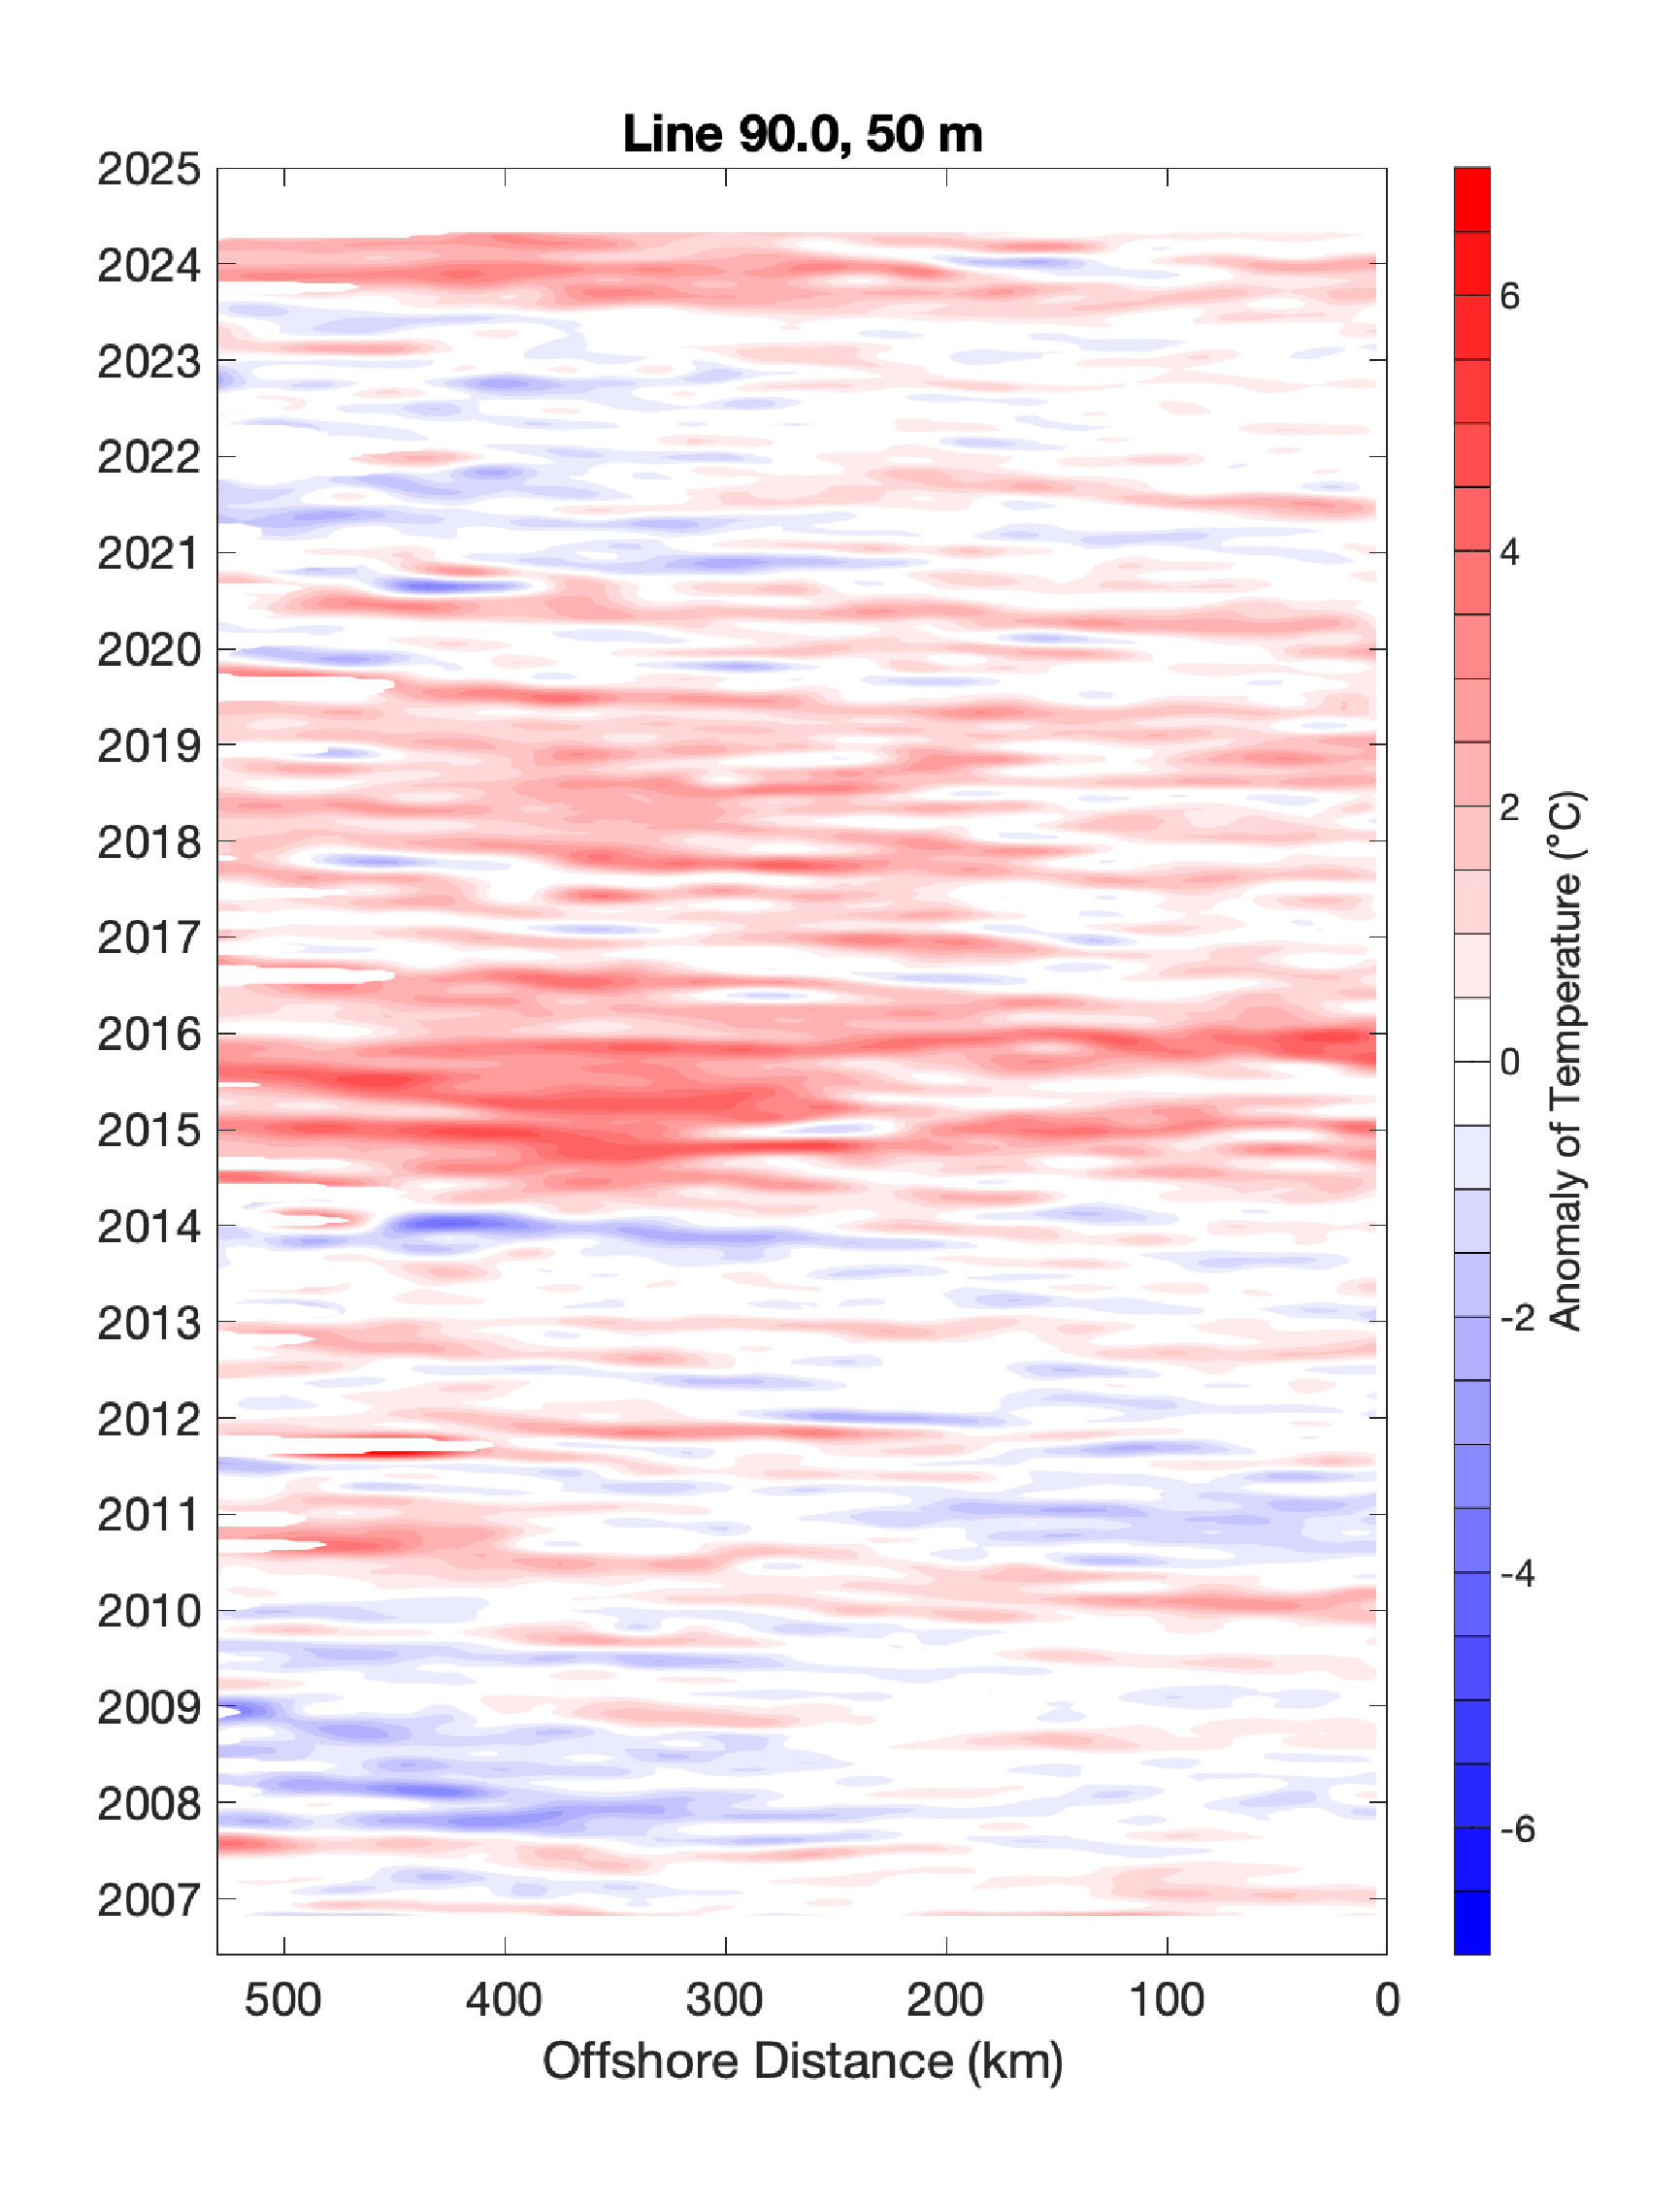
Southern California's Ocean Temperature Since 2007
The most recent two El Niños peaked in 2009/2010 and 2015/2016, when we saw strong positive anomalies at the equator and off California.
There was also a peak in the Southern California Temperature Index in 2014/2015, at a time when the Oceanic Niño Index was slowly increasing but not yet peaking.
This marine heatwave was called “The Blob” at the time, and was widely reported in the press.
History of Ocean Temperature in Southern California
Data from the Scripps Pier Shore Stations program provide historical context for the glider temperature measurements offering an extended temperature time series that dates back to 1916. The Scripps pier time series is the longest continuous record of ocean temperature on the Pacific Rim and is frequently cited as an indicator of temperature trends in the region.
Pier data have been used by scientists for many decades for studies of oceanographic and climate processes, including regime shifts, climate variability, and ocean warming.
Long time series are essential for understanding large-scale physical phenomena like El Niño–Southern Oscillation events and for tracking long-term changes in sea surface temperature and ocean heat content.
Recent Conditions and Forecasts

Weekly sea surface temperature anomalies (°C) for the past 12 weeks. Anomalies are computed with respect to the 1991-2020 base period weekly means from the adjusted optimal interpolation (OI) climatology (Reynolds and Smith 1995, J. Climate, 8, 1571-1583). Credit: NOAA Climate Prediction Center
California Underwater Glider Network observations are funded by SCCOOS and the NOAA GOMO Program.